
Reporting
Most trackers hand you one number per lift. Gym Jockey shows you what's underneath it.
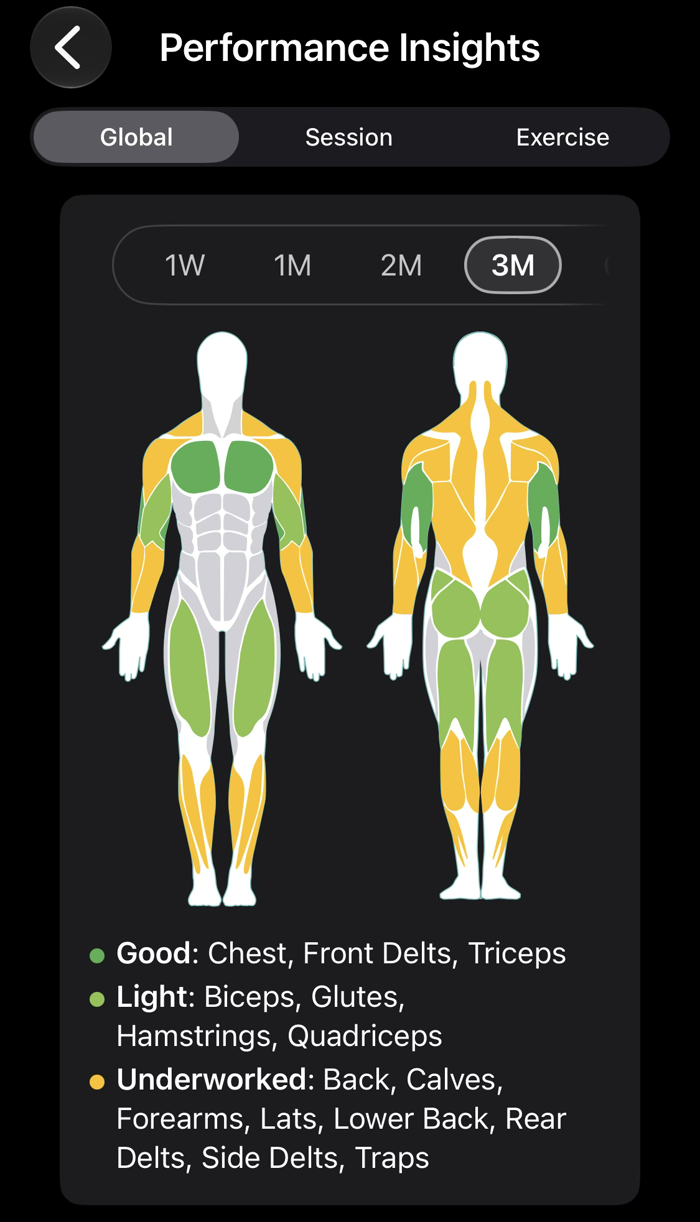
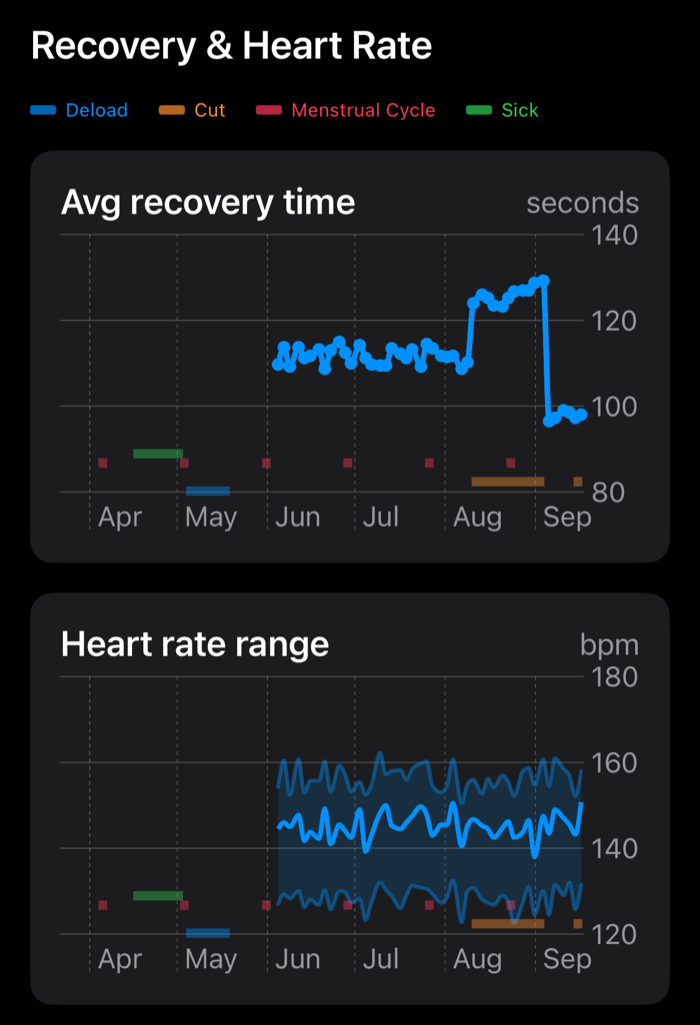
Your numbers can explain your training if you can see them in enough detail. Reports has three views, from wide to narrow: Global for your whole body, Session for your sessions, and Exercise for a single exercise. Everything you chose to track along the way, such as energy, sleep, a cut, a cold or your heart rate, is drawn against your lifts here.
The set-level truth
Pick an exercise and you get a line for each set as well as the average, and you can open any single set to see how it’s moving.
I built this out of frustration. I spent months on what looked like a plateau, with a flat average and no new records, while I suspected my last set was making real progress, if erratically. That’s how static double progression behaves: the first set reaches the top of the range, then the second, then the third, each on its own schedule, with noise on top. On a good day you max out the first three sets and the fourth still feels out of reach, so the session feels like a stall. The set-level numbers showed set four was climbing. The average would only have shown it weeks later.
Plateau detection flags a stall when there is one. The per-set lines show you any progress inside an apparent stall, or confirm that there isn’t any.
Drag to pan back through the months, tap a point to open that session, and hold to explore.

Did it show up in your numbers?
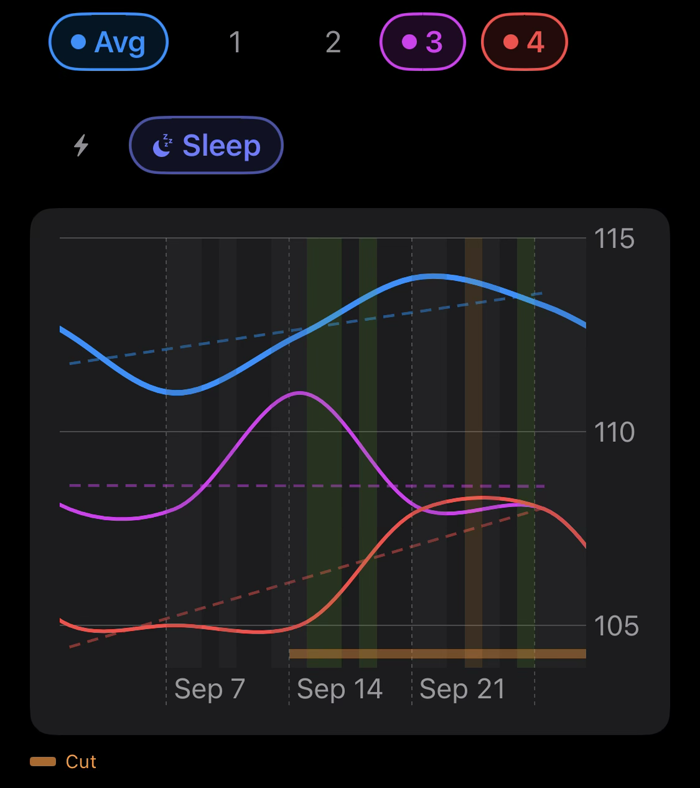
Here what you tracked becomes useful. The periods you marked (Deload, Cut, Menstrual Cycle, Minor Injury, Sick, Travel) run under the chart as horizontal bands. Events (Major Injury, Program Change, Technique Reset) are vertical lines, with a before and an after. Tap any of the check-in pills, such as energy, sleep, pain or body weight, and its trend is drawn over the chart.
If you think your sleep is hurting your numbers, you can check. Was the dip in March the cut or the cold? Did the technique reset cost you, and for how long? The chart answers it.
Where the work landed
Recovery & heart rate
Your history, on your terms
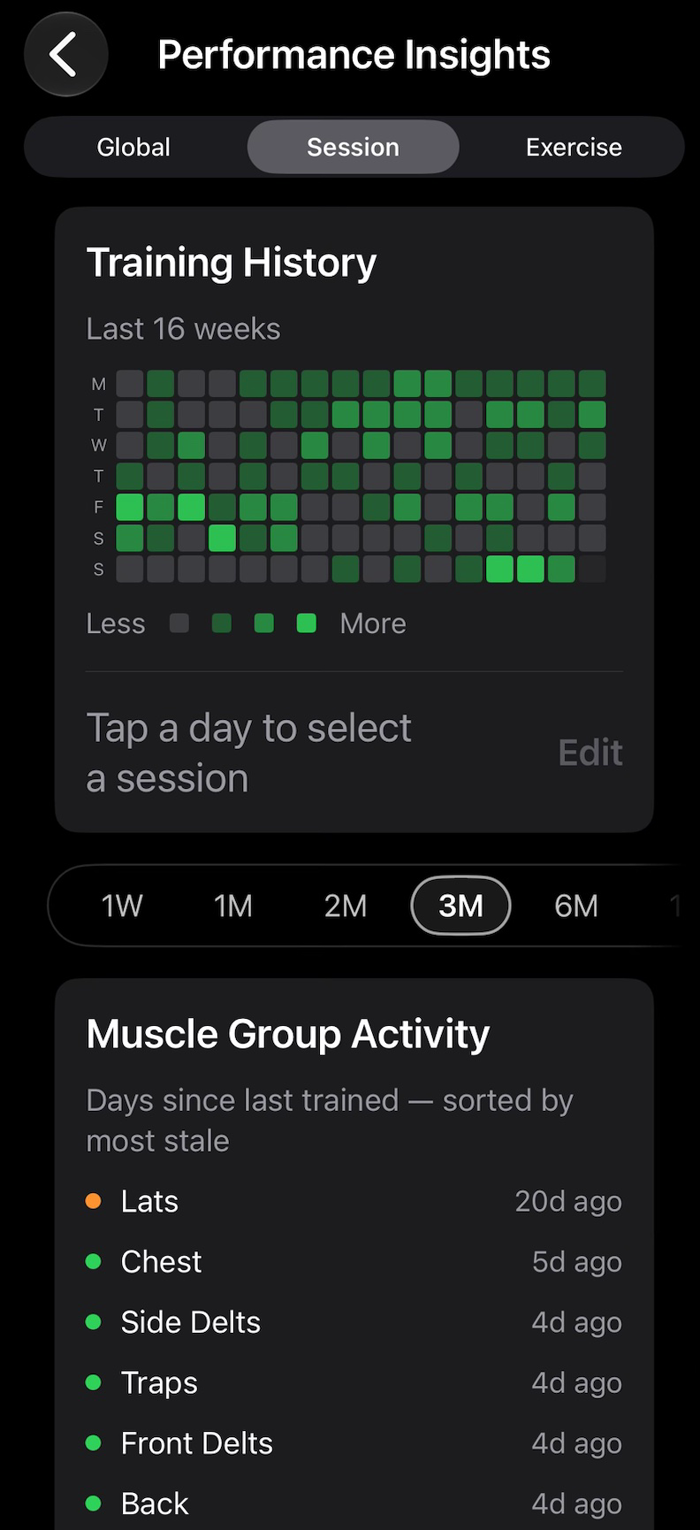
The Session view is your calendar: sixteen weeks of days, shaded by how much you did. Below it, every muscle group is listed by how long since you last trained it, most neglected first. Tap any day to open that session and edit it.
If a value looks wrong, tap it and check, from the calendar or straight from the point on the exercise chart. Every session you’ve ever done can be edited: the reps, the load, the effort and the tracking. Two settings are worth knowing. Restart progress tracking is for when you’ve changed an exercise on purpose, by going lighter or moving to a stricter, slower cadence: plateau detection starts over from that session, and your older numbers stay in your history. Forget logs is for a session that shouldn’t count, like one while traveling or teaching a friend, that you still want to keep. It stays in your history and out of your numbers.
So your history can always be corrected to match what actually happened.
Every session you log from today adds to these charts.

Open this page on your iPhone, or point its camera at the code.
On your phone: get TestFlight, open it, tap through Apple's welcome screens, then Accept and Install.
Free during the TestFlight beta. What's TestFlight?
Beta full? Get in touch.